Maximising Meeting Room Utilisation: Insights from People Counting Data
As a space utilisation manager, understanding how meeting rooms are being used is important to effectively allocate resources. One way to do this is by generating reports on meeting room utilisation. Here are some reports you can generate with People counting technology and occupancy data:
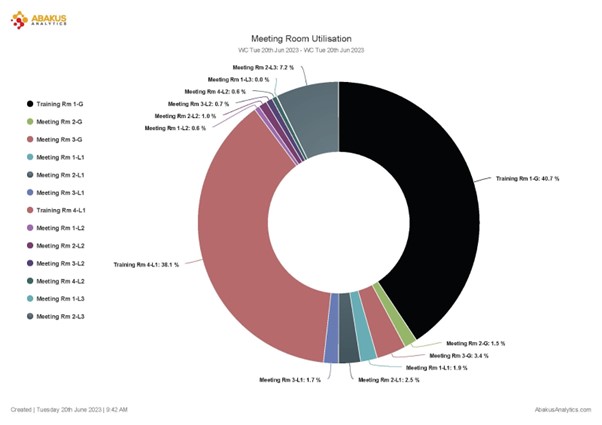
- Occupancy rate report
Shows the percentage of time each meeting room is occupied during a given period. It is calculated by dividing the total minutes the room was occupied by the total number of minutes in the period. This report helps you identify the most frequently used rooms and potential underutilised ones.
- Peak utilisation report
Shows the times when meeting rooms are most frequently used. Analysing this data helps you identify usage patterns and plan for room availability accordingly. For example, if a room is in high demand during lunchtime, rescheduling meetings could be considered.
- Average occupancy report
Presents the average number of people in each meeting room during a given period. It helps you assess room suitability for different group sizes. If a particular room is consistently overcrowded, it may be time to re-evaluate its capacity or consider adding additional meeting spaces. It also allows you to compare the attendance against the room capacity.
- Average stay report
Highlights the duration people spend in meeting rooms. This helps you identify instances where rooms are booked for longer periods than necessary. Additionally, if a meeting runs longer than scheduled, buffer time can be added around bookings to prevent overlap in the future.

- Occupancy by day report
Shows the number of people using each meeting room on each day of the week. This report helps you identify high-demand days for specific rooms. For instance, if a certain room is always busy on Mondays, fewer meetings could be scheduled in that room on that day.
- Occupancy by the time of day report
Displays the number of people using each meeting room at different times of the day. This report helps you identify peak usage times and plan room availability accordingly. If a room is consistently in high demand during the morning, you might consider scheduling fewer meetings at that time.
- Utilisation by department report
If you have people counting data broken down by department, you can generate a report that shows how much each department is using each meeting room. This can help you understand which departments have the highest demand for meeting space and allocate resources accordingly.
By generating these reports, you can gain valuable insights into how meeting rooms are being used and make informed decisions about how to allocate space and resources. Even without access to room booking information, people counting data can still provide useful insights into meeting room utilisation enabling you to make data-driven decisions about optimizing space utilisation.
Why choose Abakus Analytics?
By leveraging the powerful reports and insights provided by Abakus Analytics, you can make data-driven decisions to optimise your meeting room utilisation. Whether it’s identifying underutilised rooms, planning for peak usage times, assessing room suitability, or allocating resources based on departmental demands, Abakus Analytics equips you with the information you need to maximise your space and make the most efficient use of your resources.
Don’t settle for guess and start the journey of optimising your space now.


